
Table of contents
1. Indicator assessment
Recovering the financial costs of water services, and particularly doing so through water tariffs, is essential for improving water use efficiency in the long-term and in turn reduce the pressure on freshwater resources in Europe. Getting the price right can help ensure that water infrastructure is adequately operated, maintained and renewed.
-
-
Agree. Text has been adjusted
I think this is a little overdone. Instead of 'is essential for' I would prefer 'contributes to' or 'is important since it contributes to'
-
-
...water infrastructure is adequately operated and used
-
We coıld not be sure whether this is a statement or a suggested edit. If the latter, we would prefer to explicitly raise the issues of maintenance and renewal, beyond use
...water infrastructure is adequately operated and used
-
Water tariffs should raise the awareness of users on water scarcity and water waste issues and provide incentives for water saving and sustainable use, therefore supporting environmental protection. However, they should be accompanied with locally adequate social policies to support households that might be especially vulnerable to tariff increases, to “leave no one behind”.
-
'should raise the awareness'
I think that 'may raise the awareness' is more likely/realistic.
-
The formulation has been changed as “should be used to raise the awareness”, as this was really the intended message to policy makers.
'should raise the awareness'
I think that 'may raise the awareness' is more likely/realistic.
-
-
'water waste issues? Or do you mean wastewater issues?
-
We revised the respective sentence as "....water scarcity and water use efficiency...."
'water waste issues? Or do you mean wastewater issues?
-
EU Member States use different methods and considerations to estimate financial cost recovery of water services, which hinders direct comparisons between different countries and river basin districts (RBDs).
During the 2nd WFD RBMP reporting, 20 EU Member States and Norway reported data on financial cost recovery. These data reflect financial cost recovery levels for drinking water supply services in 54 RBDs; for sanitation services in 45 RBDs; and for both supply and sanitation services combined in 82 RBDs.
The current indicator covers assessment on 147 RBDs from 20 Member States and Norway in total.
-
For how many RBDs is no information available?
-
Information is not available for 11 RBDs, which we have added to the respective key message
For how many RBDs is no information available?
-
According to data reported under the Water Framework Directive (WFD), in 18% of the RBDs, water tariffs and other revenues recover 100% or more of the financial costs for the provision of water supply and/or sanitation services. In 57% of the RBDs financial cost recovery ranges between 80% - 100%, and in 24% of the RBDs financial cost recovery is lower than 80%. The lowest financial cost recovery is observed in RBDs of Belgium, Bulgaria, Croatia, Greece, Luxembourg, Portugal and Spain.
-
Reason for low cost recovery: either tariffs are too low (political reason, social reason…) or is there a large share of water losses in the infrastructure?
-
We acknowledge the value of such information. However, it is beyond the scope of the planned indicator.
Reason for low cost recovery: either tariffs are too low (political reason, social reason…) or is there a large share of water losses in the infrastructure?
-
Water affordability is a concern for low-income households across Europe, and it could become an issue even for middle income households. Household expenditure on water supply and sanitation services remained the lowest compared to the expenditure on other household needs (e.g. food, clothing, housing) between 2005-2019. However, when expenses on these essential needs are compounded, they often take up a very high share of the households’ disposable income. This is the case for middle income households in some eastern (e.g. Latvia, Lithuania) and southern European countries (e.g. Greece), which could make them vulnerable to tariff increases. This is not the case in some western European countries like the Netherlands, France and Ireland.
-
Relation of water/sanitation tariffs and income for each country should be added
-
We perceive this refers to each of the countries mentioned in this key message. Good point as it would illustrate the message better. However, as outcome of this Eionet consultation, we decided to take the affordability part of the indicator out of the scope and might be subject to another seperate potential indicator in the future.
Relation of water/sanitation tariffs and income for each country should be added
-
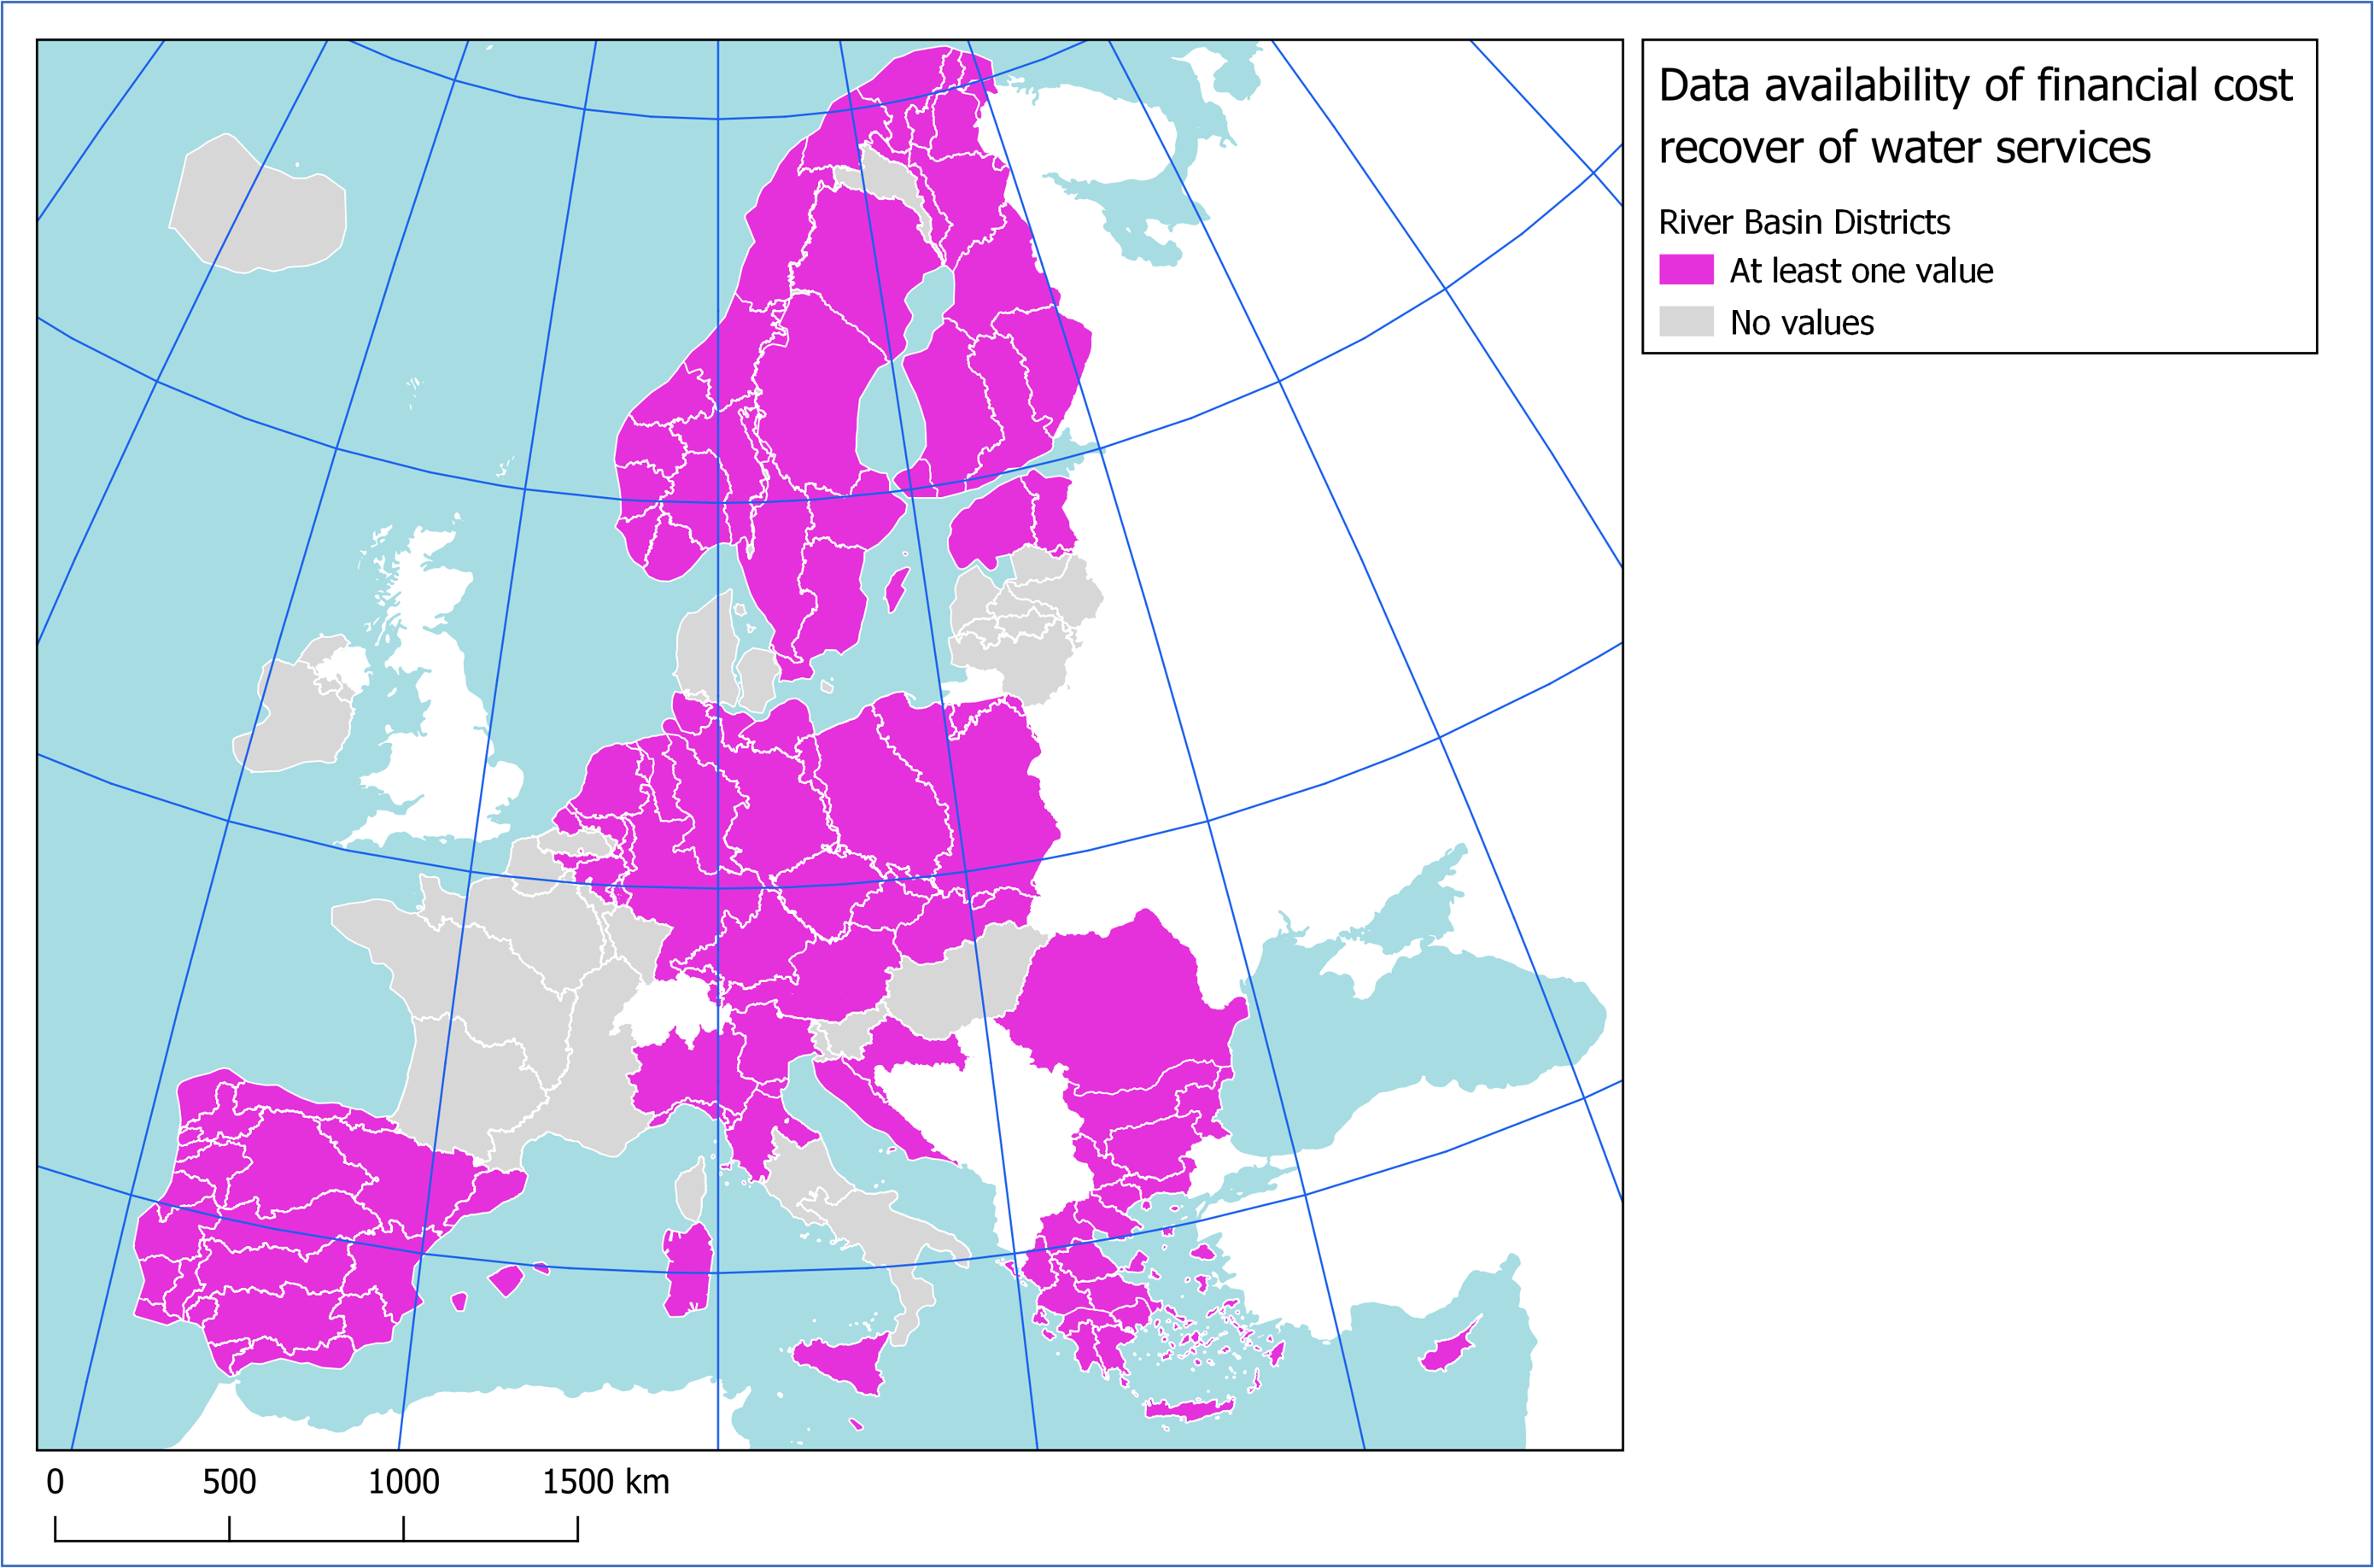
Figure 1 (main view). Financial cost recovery for public water supply and sanitation services in European RBDs in the 2nd RBMPs [indicative data view for water supply / sanitation / combined water supply & sanitation services].
Note: The dynamic map will provide detailed information on financial cost recovery and water prices for public water supply per cubic meter at the river basin level and city level; "other" types of combined water services have been excluded.
Data availability of financial cost recovery of water services (WFD 2nd RBMPs)
-
Please, edit sentence from: „The dynamic map will provide detailed information on financial cost recovery and water prices for public water supply per cubic meter at the river basin level ...“ to „The dynamic map will provide detailed information on financial cost recovery and water prices for public water supply per cubic meter and/or water price for sanitation servises per waste water cubic meter at the river basin level ...“.
-
We have adjusted the text under the note section of the Map. Thanks
Please, edit sentence from: „The dynamic map will provide detailed information on financial cost recovery and water prices for public water supply per cubic meter at the river basin level ...“ to „The dynamic map will provide detailed information on financial cost recovery and water prices for public water supply per cubic meter and/or water price for sanitation servises per waste water cubic meter at the river basin level ...“.
-
-
Which period are the data referring to?
-
2nd cycle of WFD RBMP reporting
Which period are the data referring to?
-
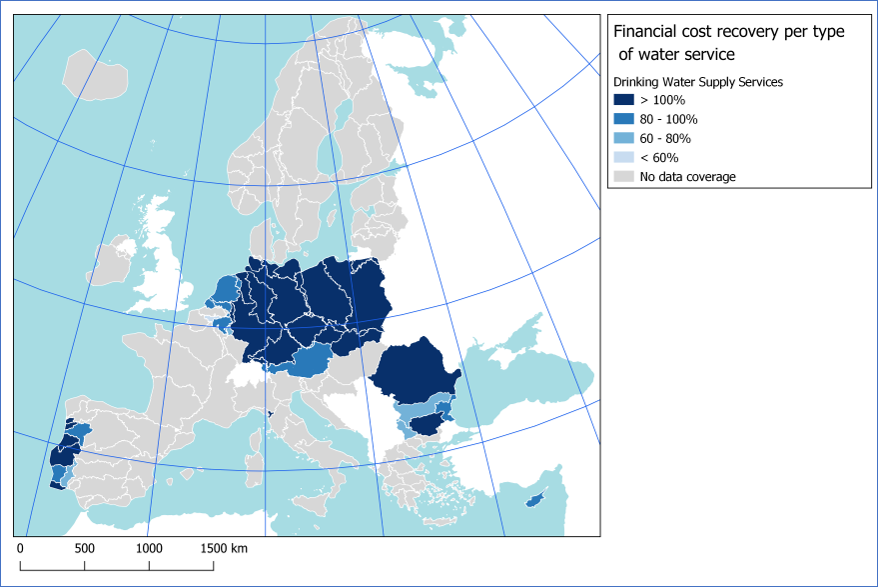
Financial cost recovery for drinking water supply services
-
Map: the maximum and minimum value for cost recovery should be added
-
The countries with lowest recovery levels are listed in one of the key messages. Apart from that, adding information on outliers here would not add value to the visualisation.
Map: the maximum and minimum value for cost recovery should be added
-
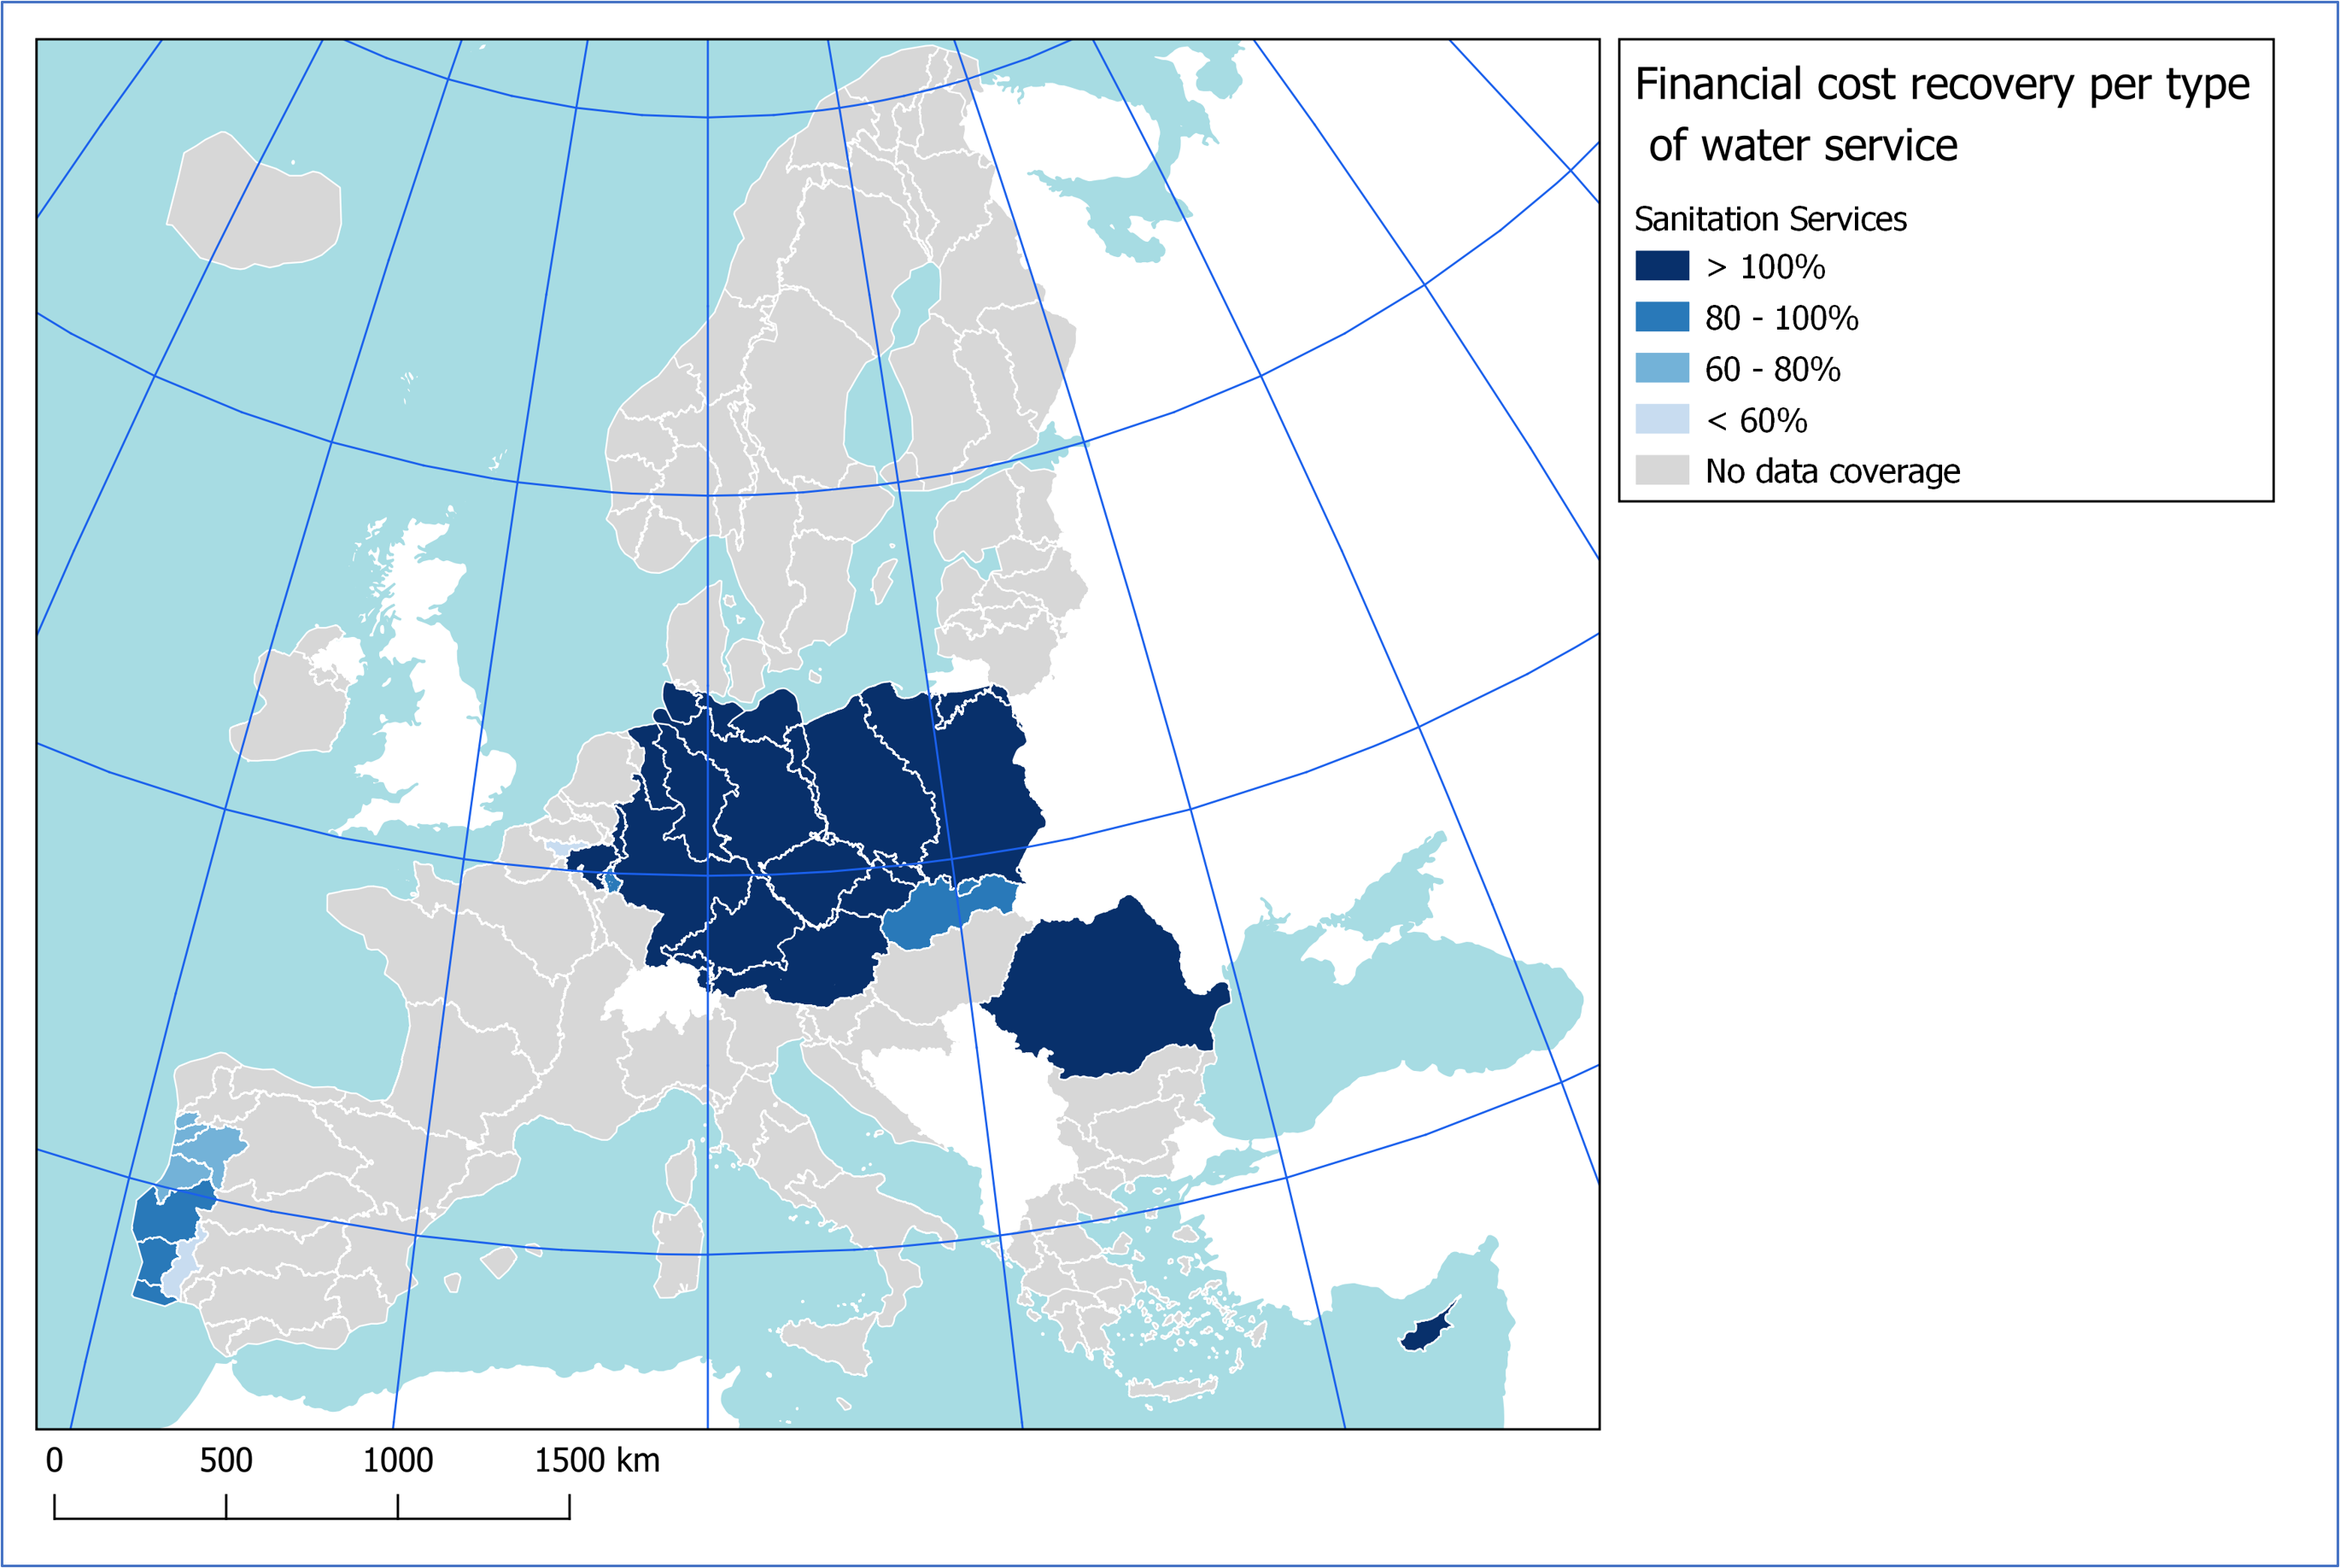
Financial cost recovery for sanitation services
-
Map: the maximum and minimum value for cost recovery should be added
-
Please see the EEA response to the previous comment.
Map: the maximum and minimum value for cost recovery should be added
-
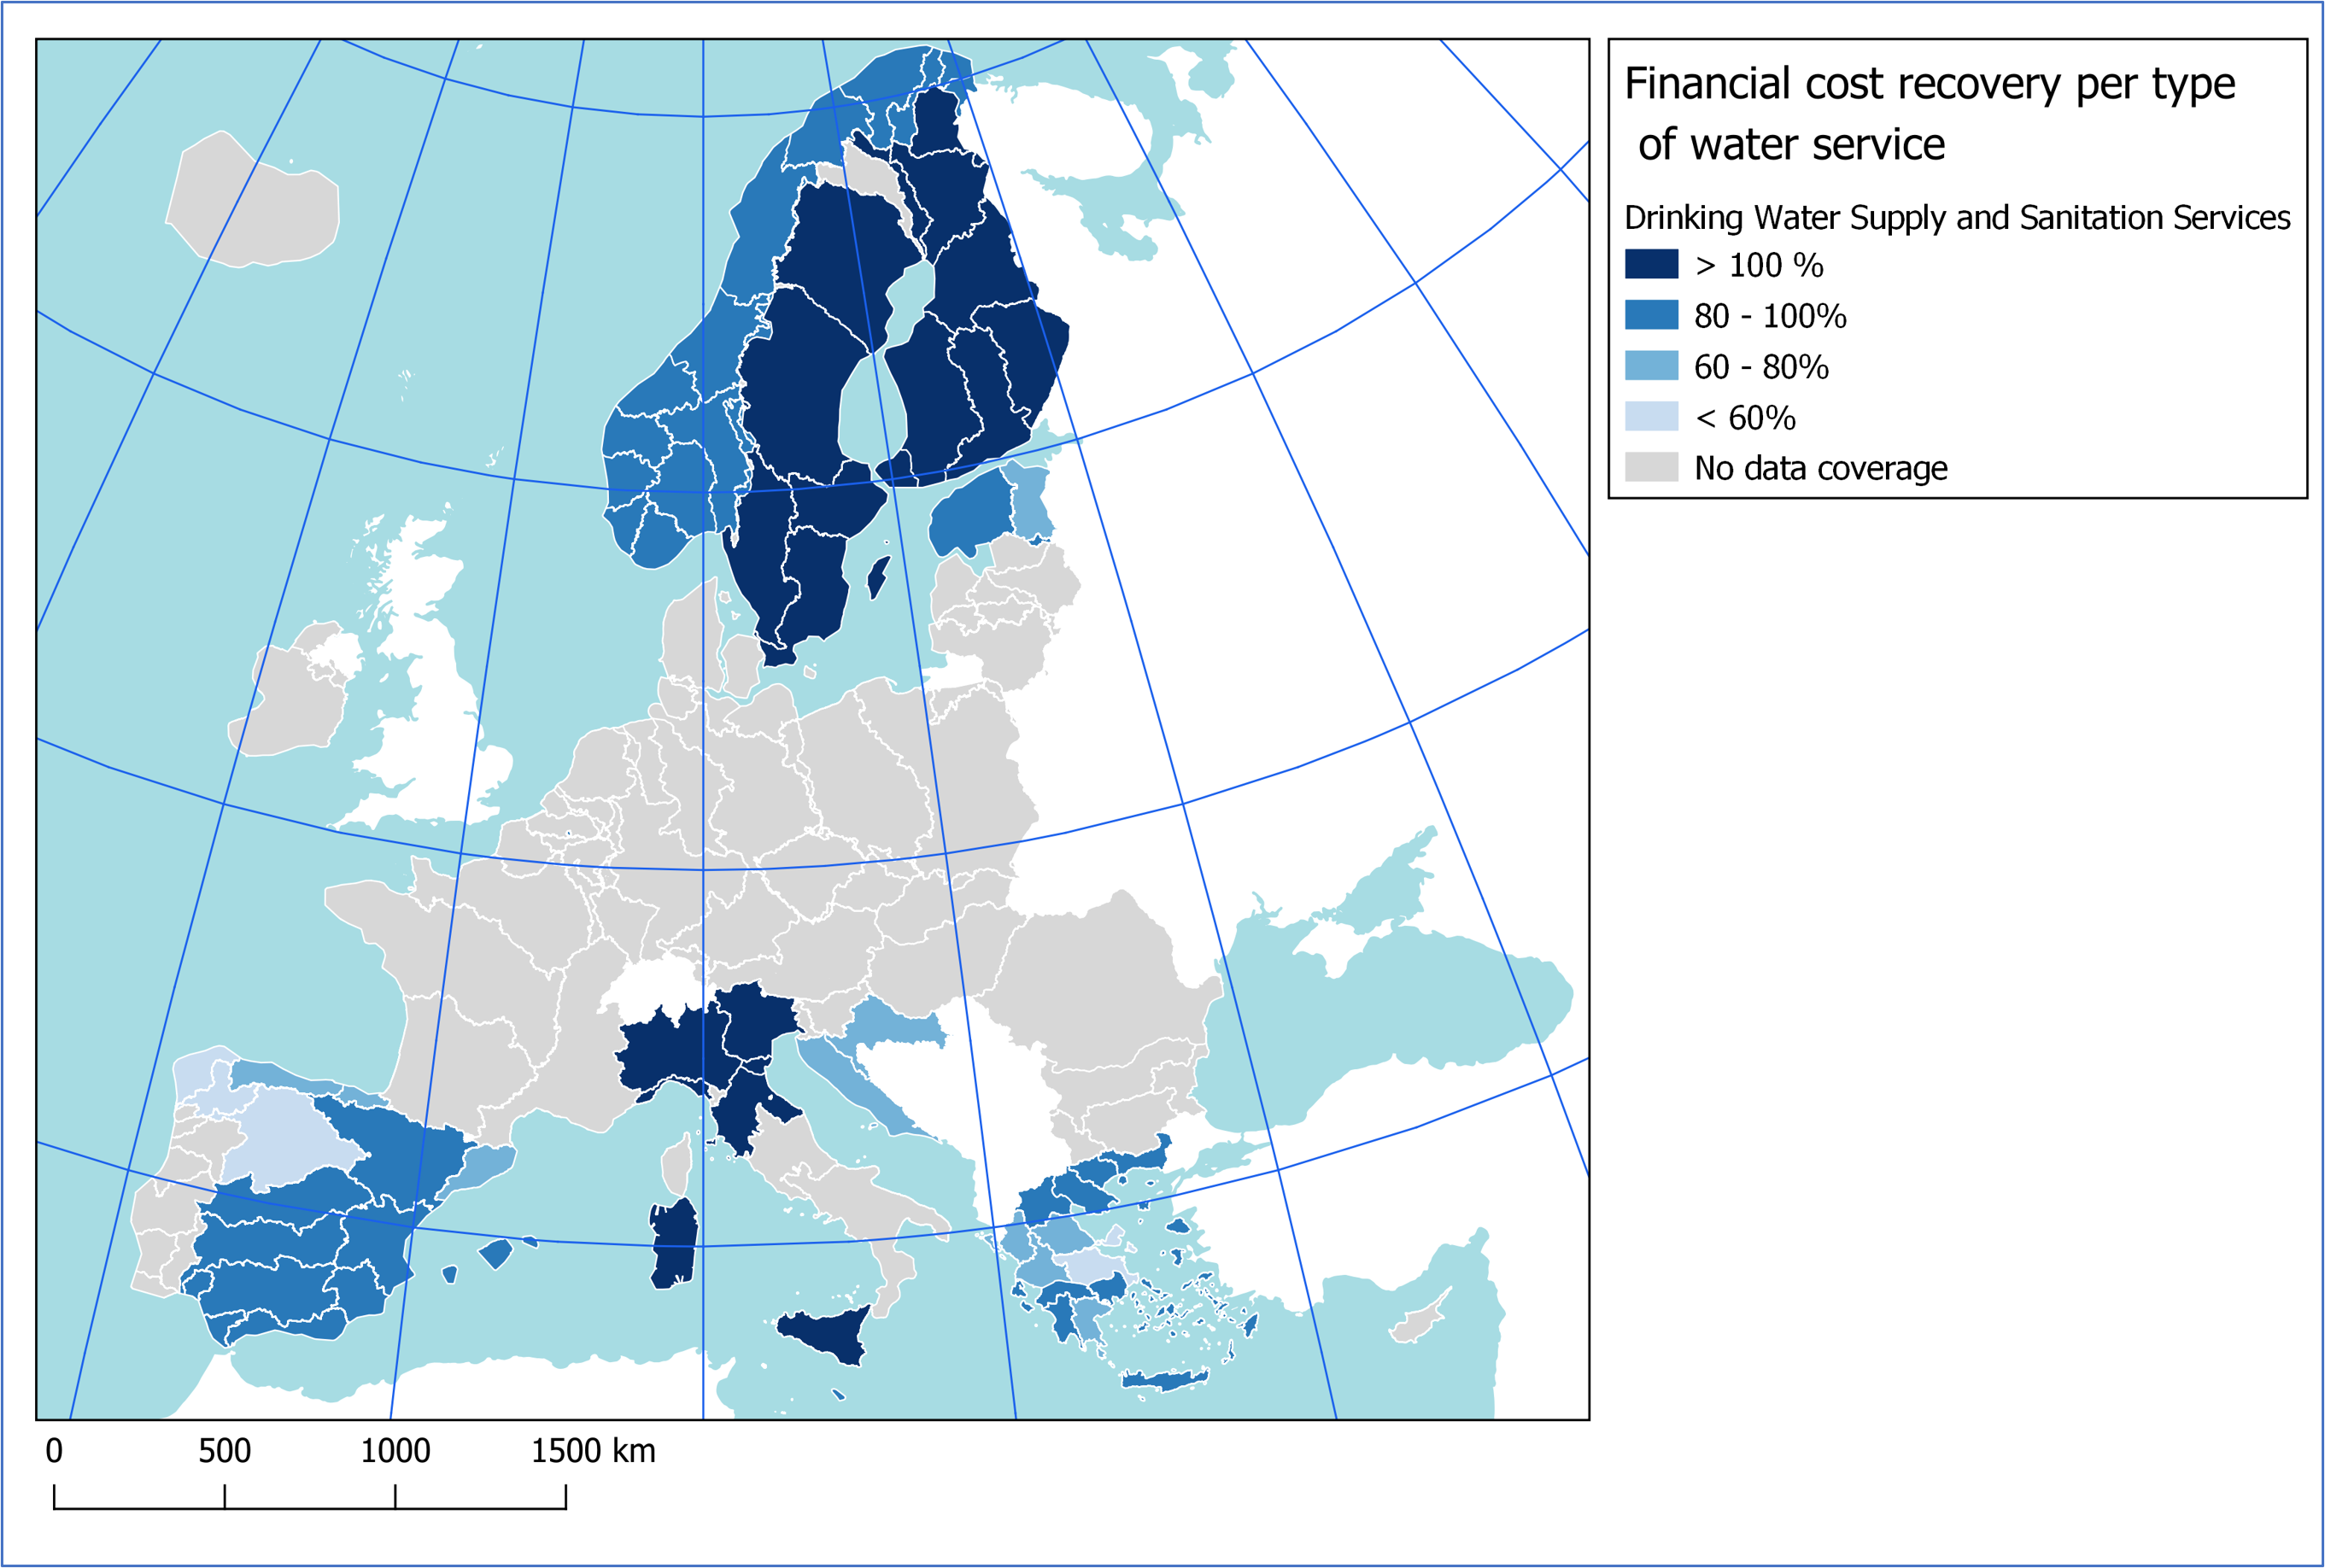
Financial cost recovery for drinking water supply and sanitation services
-
Map: the maximum and minimum value for cost recovery should be added.
Just add: "...when considered together and no differentiation is made between drinking water and sanitation services."
-
We adopted tresholds for simplifying the map illustration. The dynamic map may provide the actual value.
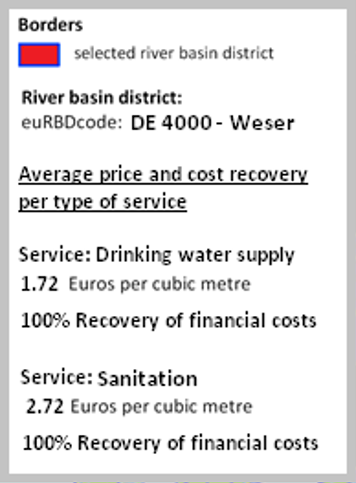
Figure 1 (complementary view). Average price level of combined water supply and sanitation services in main European cities in between 2000-2019 [indicative data view for Brussels city].

(under the dynamic map)
Note: Financial cost recovery levels are shown for the following services reported by the EU Member States: “Drinking water abstraction (surface and/or groundwater), treatment and distribution”; “Sewage collection and wastewater treatment”; “Drinking water abstraction (surface and/or groundwater), treatment and distribution and sewage collection and wastewater treatment (when considered together)”
Data source: 2nd RBMPs (WFD 2016 database; Schema: RBMP PoM – Service)
-
I have a problem here: you look at “Sewage collection and wastewater treatment" in combination. In the Netherlands we have these two activities as two seperate water services. For both water services the cost recovery rate is approximately 100%. For wastewater treatment, full cost recovery is even laid down in law. Occasionnally, from one year to the other cost recovery rates may differ from 100%, but it the long run, regional water boards are not allowed to make profits nor losses. Regional water authorities estimate their costs a year before and according to those estimates, they fix their tariffs. If during the year costs appear to be higher than expected for that year, tariffs may be increased the next year to compensate for the difference. In this way 100% cost recovery is guaranteed. This applies to wastewater treatment, but also to drinkingwater production and delivery. For drinkingwater you have taken a number slightly lower than 100% since that was reported in our River Basin Management Plan. But also here over the course of a couple of years, cost recovery should be 100%, by law.
-
Thanks for this very good insight into the mechanism. We include part of this text in the additional information, as an example under the Accuracy and Uncertainty sub-section. However, it should be noted that these are aspects that by design fall out of the scope of an indicator format. Incorporating such insights is indeed highly relevant and much more illustrative of the real situation, yet it would require an extended report format where this can be explored for as many countries or RBDs as the resources dedicated to the study allow.
I have a problem here: you look at “Sewage collection and wastewater treatment" in combination. In the Netherlands we have these two activities as two seperate water services. For both water services the cost recovery rate is approximately 100%. For wastewater treatment, full cost recovery is even laid down in law. Occasionnally, from one year to the other cost recovery rates may differ from 100%, but it the long run, regional water boards are not allowed to make profits nor losses. Regional water authorities estimate their costs a year before and according to those estimates, they fix their tariffs. If during the year costs appear to be higher than expected for that year, tariffs may be increased the next year to compensate for the difference. In this way 100% cost recovery is guaranteed. This applies to wastewater treatment, but also to drinkingwater production and delivery. For drinkingwater you have taken a number slightly lower than 100% since that was reported in our River Basin Management Plan. But also here over the course of a couple of years, cost recovery should be 100%, by law.
-
The financial costs of water supply and sanitation services include operational and maintenance costs, capital investments, and management costs of water service providers (EC, 2003). These can be recovered through revenues from tariffs, associated taxes, and transfers of public funds (national and EU). While data availability on financial cost recovery and water service prices has improved between the 1st and 2nd RBMP cycles (Strosser et al., 2021), large contextual differences restrict comparative analyses. The service price varies both among RBDs within the same country and across countries, as it is influenced by national and local socio-economic policies and conditions, availability and accessibility of water resources, quality of the service, and the cost categories transferred to the user. Similarly, financial cost recovery calculations may vary due to methodological inconsistencies, and estimates should be interpreted with careful consideration of contextual factors like national regulation and reliance on public funding. For instance, in some cases national regulation does not allow service providers to charge users for the costs of infrastructure that has been paid with public funds.
-
Another issue is that the current study primary focusses on tariff per m3. Some countries use other units for their tarifs. For example in the Netherlands, wastewater treatment is based on pollution equivalents, not on m3.
-
Same as above. We adress it under the uncertainity section of the indicator
Another issue is that the current study primary focusses on tariff per m3. Some countries use other units for their tarifs. For example in the Netherlands, wastewater treatment is based on pollution equivalents, not on m3.
-
Acknowledging the methodological challenges associated with the economic aspects of the WFD, this indicator has been designed to help reactivate the discussion on these topics by illustrating the current data capacity on a) the financial cost recovery and water service price levels as reported by MS, and b) the affordability of water services in Europe.
European citizens (EU 27 + Norway) pay on average between 0.26-2.56 Euro/m3 for drinking water abstraction, treatment and distribution services (“public water supply”). In the 2nd RBMPs, recovery of financial costs of public water supply was higher than 100% in 23 RBDs and between 80%-100% in 25 RBDs. In some RBDs, such as Odra RBD, Czechia, the financial cost recovery rate for public water supply was as high as 128%, whereas in the international RBD of the Scheldt, Belgium, the financial cost recovery rate was reported lower than 1%. 10 RBDs did not report financial cost recovery data for this service in the 2nd RBMPs.
-
I am not sure what prices are taken here for the Netherlands. In the Netherlands we have a price per m3 to cover the variable part of the costs of purification of water so it can be used as drinking water, but also a fixed rate that covers the costs for the infrastructure. So if one only focusses on the price/m3, you are only looking at part of the costs. Moreover, if your consumption is low, your fixed rate might even be the largest share of the bill. (The revenues from all bills will in the end cover 100% of the total costs for purifcation and distribution of drinkingwater).
-
The methodology is provided in the relevant Eurostat manual: https://ec.europa.eu/eurostat/documents/3859598/8012444/KS-GQ-17-006-EN-N.pdf
The price per m3 is readjusted and it includes all relevant costs: basic fee, rent of meter, sewerage charge and taxes, other charges and taxes, etc.
I am not sure what prices are taken here for the Netherlands. In the Netherlands we have a price per m3 to cover the variable part of the costs of purification of water so it can be used as drinking water, but also a fixed rate that covers the costs for the infrastructure. So if one only focusses on the price/m3, you are only looking at part of the costs. Moreover, if your consumption is low, your fixed rate might even be the largest share of the bill. (The revenues from all bills will in the end cover 100% of the total costs for purifcation and distribution of drinkingwater).
-
-
2nd sentence "...higher than 100% in 23 RBDs with a maximum of xxx %
Last sentence is unclear. 10 RBDS is only correct if these 10 RBDs reported costs on the other service but not this.
How many RBDs did not report any cost data? Are they counted here?-
10 RBDs reported the service but did not report % recovery (i.e. NULL)
2nd sentence "...higher than 100% in 23 RBDs with a maximum of xxx %
Last sentence is unclear. 10 RBDS is only correct if these 10 RBDs reported costs on the other service but not this.
How many RBDs did not report any cost data? Are they counted here?
-
Sewage collection and wastewater treatment (“sanitation”) is another type of service considered. This service is particularly important for reducing the pollution pressure on surface and groundwater resources and freshwater ecosystems. European citizens pay on average between 0,27-4,52 Euro/m3 for sanitation services. The service price paid by users in 19 RBDs covers over 100% of the financial costs associated to keeping the collection and treatment system operational (e.g. 119% in Odra RBD, Czechia). In further 18 RBDs the financial cost recovery ranges between 80-100%, and in 4 RBDs between 60-80%. Financial cost recovery for this service is less than 60% in 4 RBDs (10% in Azores RBD, Portugal; 2.5% in the international RBD of the Seine, Belgium; 1% in the international RBD of the Scheldt, Belgium). 10 RBDs did not report data on financial cost recovery for this service.
-
As stated before, in the Netherlands sewage collection and wastewater treatment are considered to be two seperate water services, each with it's own cost recovery mechanism (and responsible authority). I do have some problems with the fact that this report tends to suggest that in the Netherlands we do not have cost recovery for 'sanitation', although the reason why the Netherlands is not included in the numbers presented here is only because we consider sewerage collection and wastewater treatement as seperate water services (both with cost recovery rates close to 100%). I would like to have a footnote somewhere acknowledging this.
-
NL reports Sanitation under "other services" (mixed) to the WFD RBMP database, so it cannot be shown with the rest countries. It is not clear to us why sanitation was not reported as sanitation by the Member States.
As stated before, in the Netherlands sewage collection and wastewater treatment are considered to be two seperate water services, each with it's own cost recovery mechanism (and responsible authority). I do have some problems with the fact that this report tends to suggest that in the Netherlands we do not have cost recovery for 'sanitation', although the reason why the Netherlands is not included in the numbers presented here is only because we consider sewerage collection and wastewater treatement as seperate water services (both with cost recovery rates close to 100%). I would like to have a footnote somewhere acknowledging this.
-
-
As stated before, in the Netherlands we do not have a price per m3 for wastewater, but the tariff is related to the number of pollution equivalents. In this way we make sure that each polluter pays.
With respect to households, it may be questionnable whether paying per m3 would stimulate people to discharge less wastewater. Do we really expect that charging people per m3 wastewater will result in people going to the toilet less often? So here, the incentive can be expected to be negligable. For industries the discussion is different. Also there we charge according to pollution loads, but they often have options to reduce their load, or can decide to treat their wastewater themselves (self service; 100% cost recovery).
-
... in 4 RBDs (10% in Azores RBD, Portugal; 2.5% in the international RBD of the Seine, Belgium; 1% in the international RBD of the Scheldt, Belgium). - the listed RBDs are only 3 and not 4 as mentioned before the brackets.
Last sentence is unclear. 10 RBDS is only correct if these 10 RBDs reported costs on the other service but not this.
How many RBDs did not report any cost data? Are they counted here?-
Countries report combined services but not cost recovery % (i.e. NULL).
... in 4 RBDs (10% in Azores RBD, Portugal; 2.5% in the international RBD of the Seine, Belgium; 1% in the international RBD of the Scheldt, Belgium). - the listed RBDs are only 3 and not 4 as mentioned before the brackets.
Last sentence is unclear. 10 RBDS is only correct if these 10 RBDs reported costs on the other service but not this.
How many RBDs did not report any cost data? Are they counted here?
-
In many RBDs, price levels are reported for combined water supply and sanitation services. The average price levels in such cases range between 0,16-4,18 Euro/m3. Recovery of financial costs is higher than 100% in 9 RBDs (e.g. 123% in Kokemäenjoki Bothnian sea RBD, Finland), and 80%-100% in 52 RBDs. 60-80% cost recovery is observed in 15 RBDs and less than 60 % in 6 RBDs (e.g. 36% in Minho RBD, Spain). 2 RBDs did not report data on the combined water supply and sanitation services.
-
1st sentence: In many RBDs... - how many RBDs
2nd sentence: ...0,16-4,18 Euro/m3 - That’s less than the average for sanitation services
3rd sentence: Recovery of financial costs is higher than 100% in 9 RBDs with a maximum of xxx % in...
Last sentence: How do you know that these 2 RBDs should have reported combined costs and not individual costs for the services?
-
Countries report combined services but not cost recovery % (i.e. NULL).
1st sentence: In many RBDs... - how many RBDs
2nd sentence: ...0,16-4,18 Euro/m3 - That’s less than the average for sanitation services
3rd sentence: Recovery of financial costs is higher than 100% in 9 RBDs with a maximum of xxx % in...
Last sentence: How do you know that these 2 RBDs should have reported combined costs and not individual costs for the services?
-
The lowest financial cost recovery is generally observed in RBDs of Belgium, Bulgaria, Croatia, Greece, Luxembourg, Portugal and Spain.
-
Can you add any reason for these low cost recoveries?
-
Only respective countries can provide insight on this.
Can you add any reason for these low cost recoveries?
-
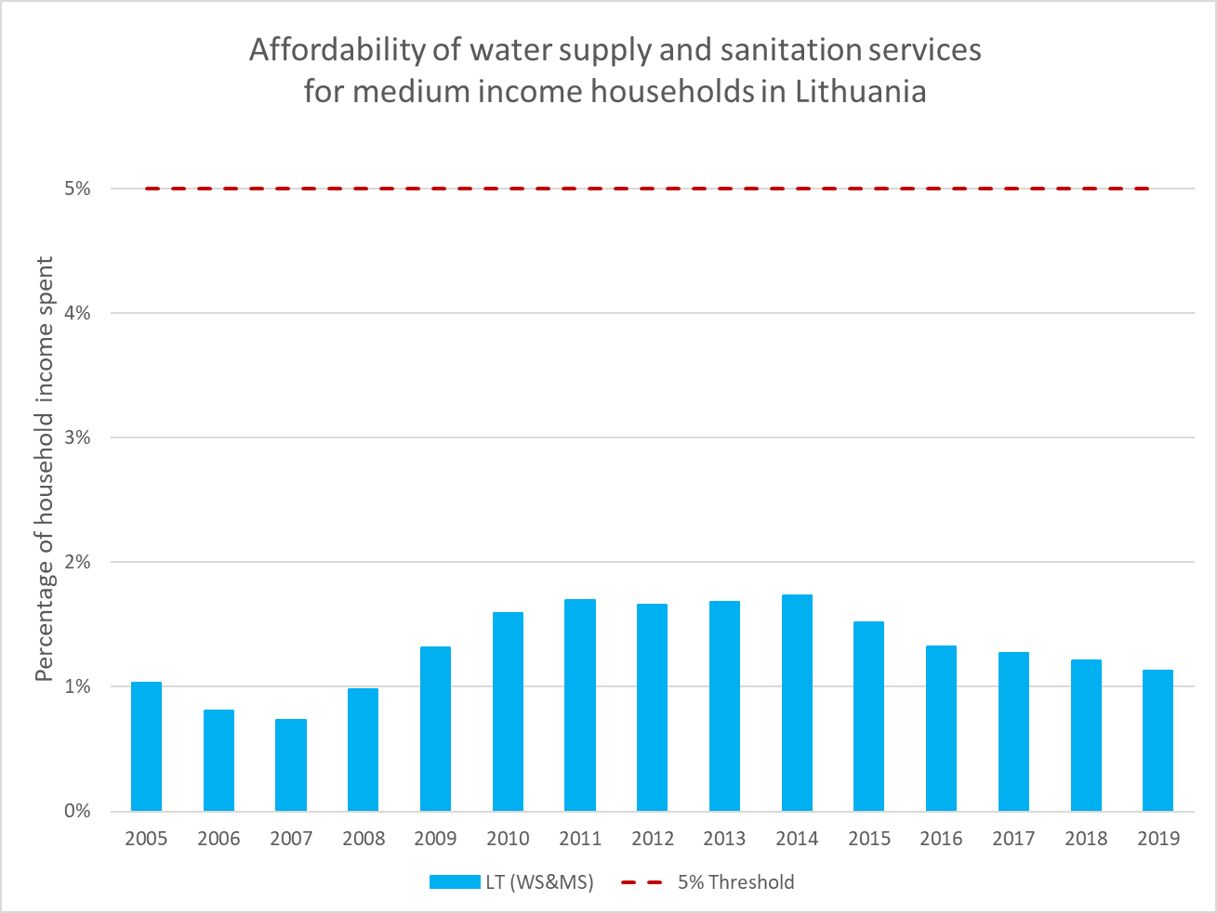
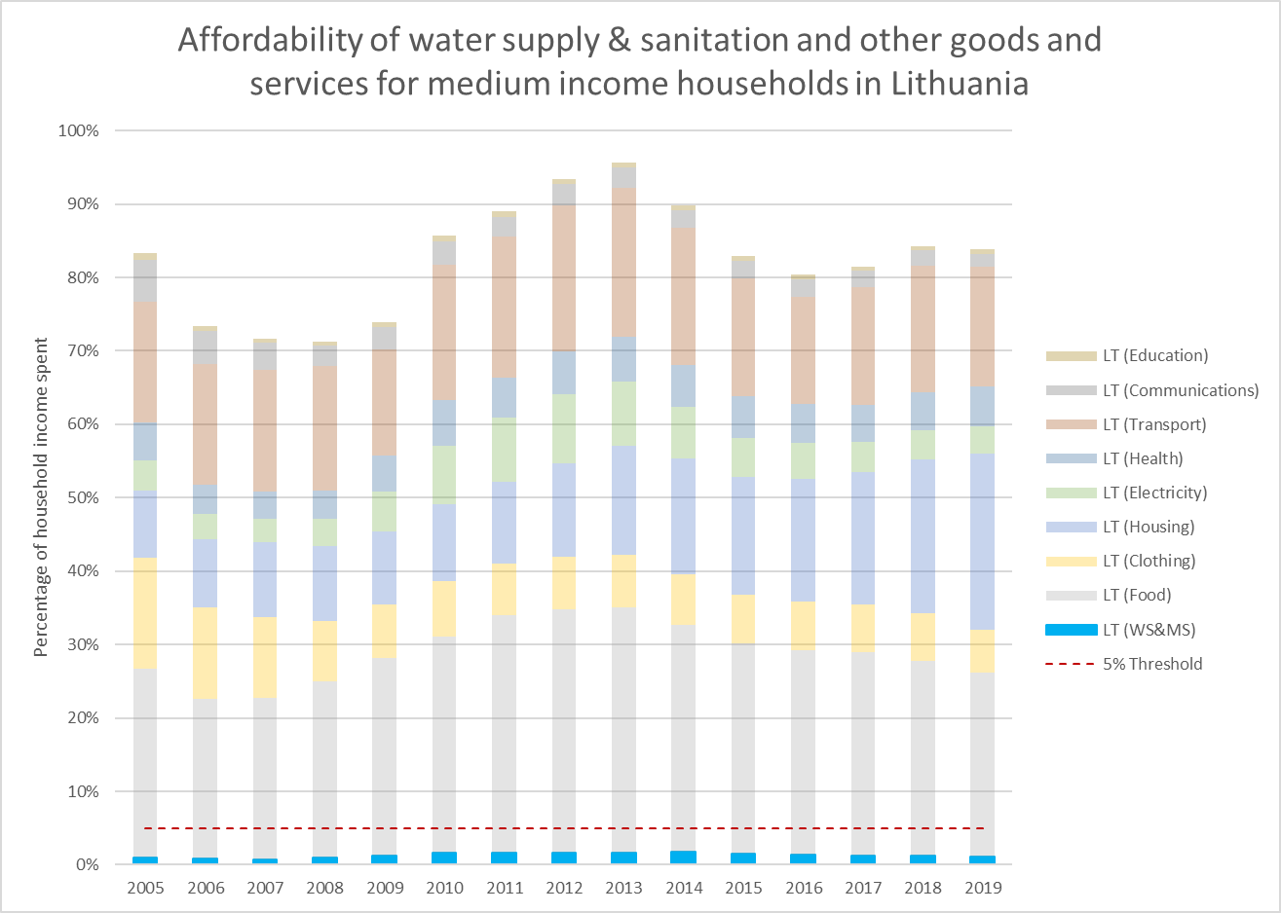
Figure 2 (main view). Affordability of water supply and sanitation services (relative to other household needs) over the period 2005-2019. [indicative data view for medium income households in Lithuania].
NOTE: Final scale and structure of illustrating the information on affordability will be decided at the later stages in accordance with capability of EEA IT infrastrucure
Data source: Eurostat (Final consumption expenditure of households by consumption purpose (COICOP 3 digit) [NAMA_10_CO3_P3__custom_1306597]; Number of private households by household composition, number of children and age of youngest child [lfst_hhnhtych]; Average household size - EU-SILC survey [ilc_lvph01]; Mean and median income by household type - EU-SILC and ECHP surveys [ilc_di04]; and Distribution of income by quantiles - EU-SILC and ECHP surveys [ilc_di01].
-
I've had a look at the Excel table. I don't understand how this affordability indicator has been calculated. Could this be explained more clearly in the text?
-
In the coming weeks, we will share with you the original file in which all calculation can be followed transparently.
I've had a look at the Excel table. I don't understand how this affordability indicator has been calculated. Could this be explained more clearly in the text?
-
-
How does the graph fit to the statement on the first page … it’s a high share of ….
Would be good to explain WS&MS in the Legend (LT (WS&MS)
Additional tab- for a view of the relative burden of water services on household income against other household needs
-
As stated in the beginning of this document: Data are incomparable across countries. So we are looking here at numbers that are completely incoparable. But by puting them in one graph, it is suggested that they are comparable, and also people looking at this report and this graph will tend to compare accross countries. Be clear what we are looking at and whether we can compare those data or not. If the data are incomparable, then one should not put them in a way that invites people to compare them...
-
We show one MS across time; not multiple MS in the same graph. So we tries to technically avoid this direct cross-comparison. However, we acknowledge the natural perception of the end user on this chart. Nevertheless, as outcomes of the EIONET consultation, EEA has decided to omit the affordability component of the indicator
As stated in the beginning of this document: Data are incomparable across countries. So we are looking here at numbers that are completely incoparable. But by puting them in one graph, it is suggested that they are comparable, and also people looking at this report and this graph will tend to compare accross countries. Be clear what we are looking at and whether we can compare those data or not. If the data are incomparable, then one should not put them in a way that invites people to compare them...
-
-
fifth percentile income data?
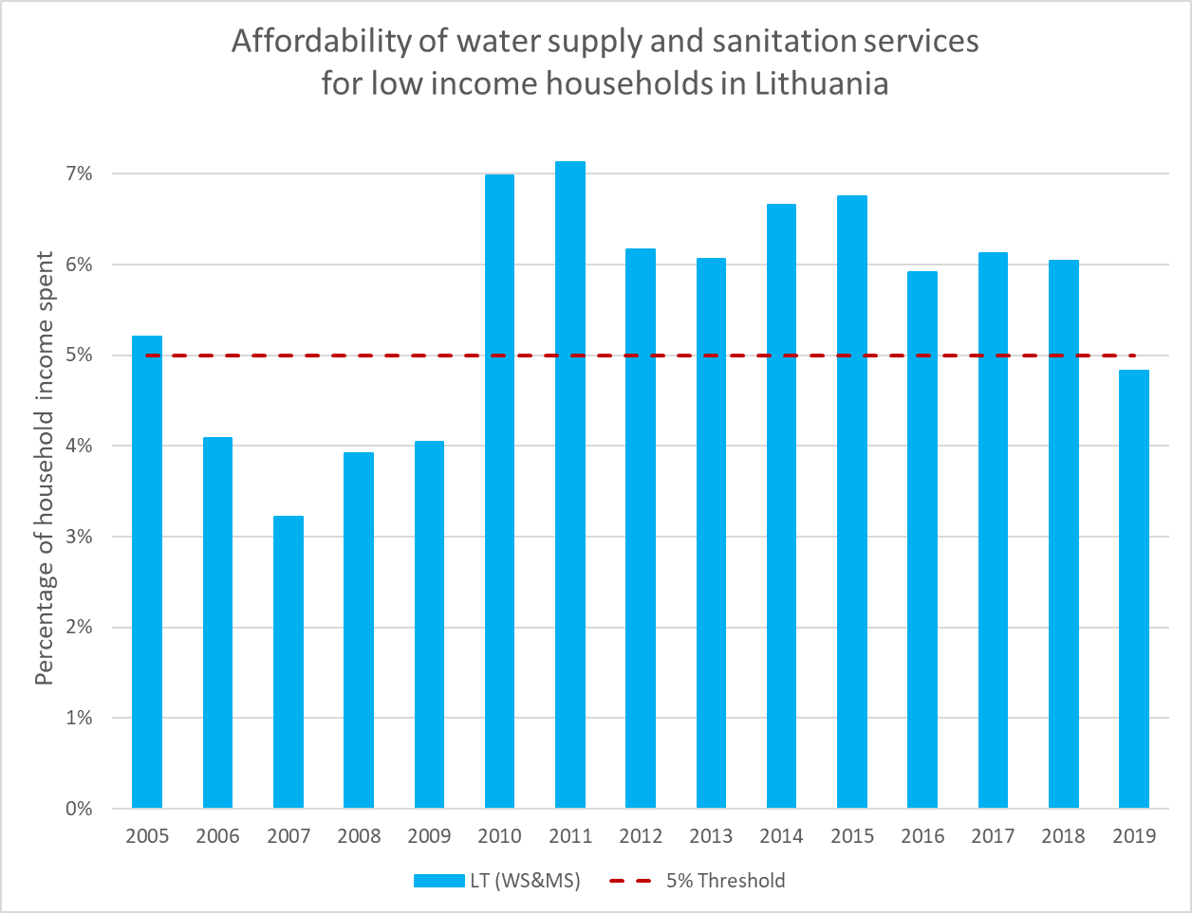
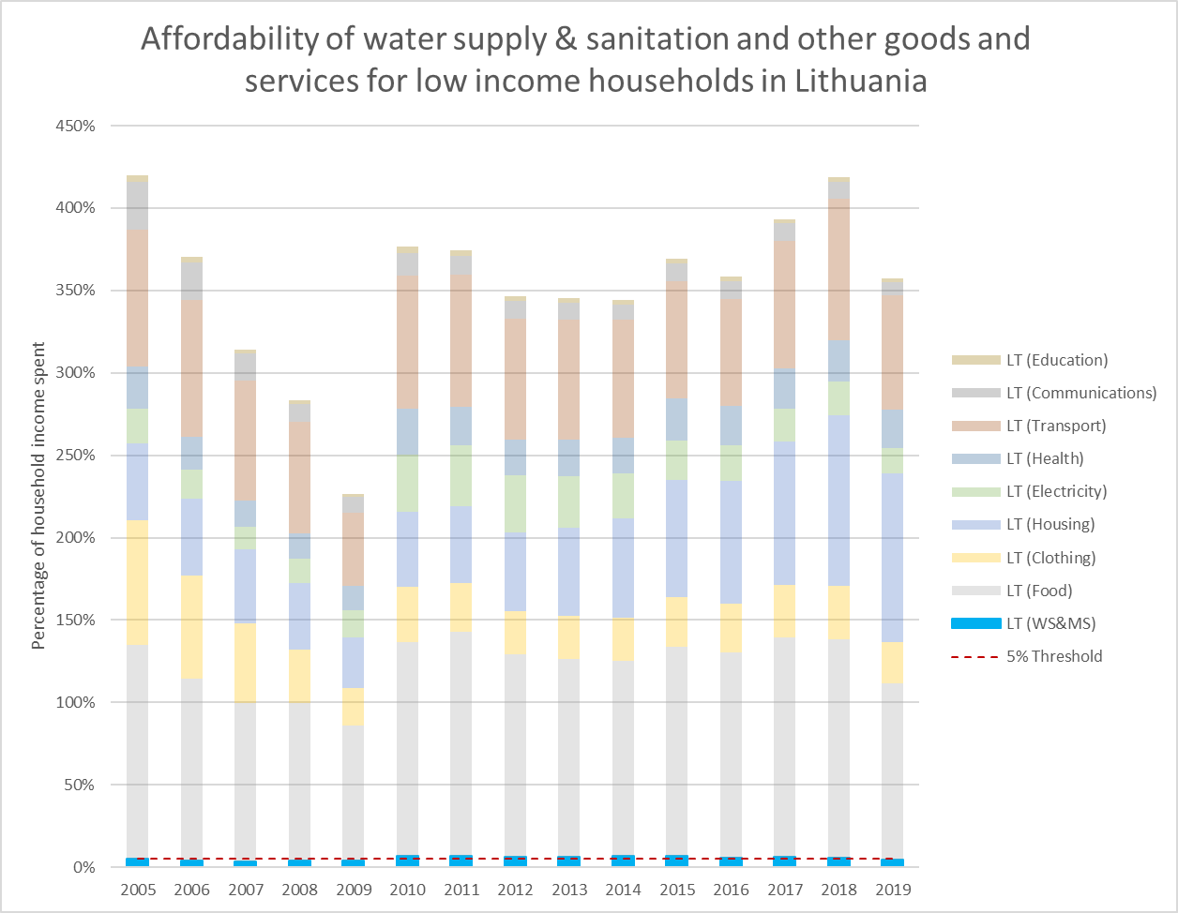
Figure 2 (complementary view). Affordability of water supply and sanitation services (relative to other household needs) over the period 2005-2019. [indicative data view for low income households in Lithuania].
Additional tab- relative burden of water services on household income against other household needs
-
The y-axis says that a low income household in Lithuania spends about 4-times of its income on household needs? How does that work?
Sorry I do not understand the description of the methodology in chapter to understand why the % (in y-axis) can be larger than 100%. Maybe an example in chapter 2 would be great.
-
This is explained in the Accuracy and Uncertainty section. The only available dataset on household expenditure is for average households and not for low-income ones. The data is aggregated from surveys and averaged, so it is not the actual expenditure of each single household in the country. However, the technical team considered it useful to indicate how far that segment of society is from being able to afford the standard of life (in terms of expenditure) of average households.
The y-axis says that a low income household in Lithuania spends about 4-times of its income on household needs? How does that work?
Sorry I do not understand the description of the methodology in chapter to understand why the % (in y-axis) can be larger than 100%. Maybe an example in chapter 2 would be great.
-
Note: Geographical coverage: Belgium, Bulgaria, Czechia, Denmark, Germany, Estonia, Ireland, Greece, Spain, France, Croatia (from 2009), Italy, Cyprus, Latvia, Lithuania, Luxembourg, Hungary, Malta, Netherlands, Austria, Poland, Portugal, Romania, Slovenia, Slovakia, Finland, North Macedonia (from 2011), Serbia (from 2012).
Affordability of water services
The WFD requires using economic instruments to promote efficient and sustainable water use and to contribute to the long-term protection of Europe’s water resources. EU Member States are requested to incorporate principles such as full cost recovery and incentive water pricing into their pricing schemes for water services. Simultaneously, water services should remain affordable for all segments of society, in accordance with the “Leaving no one behind” principle of the 2030 Agenda for Sustainable Development and the EU 2030 target on poverty and social exclusion. The interplay between these policy objectives may limit the extent to which water tariffs can leverage cost recovery levels (OECD, 2020).
-
'EU Member States are requested to incorporate principles such as full cost recovery and incentive water pricing into their pricing schemes for water services.'
This is not what the WFD asks from us: Art 9 says 'Member States shall take account of the principle of recovery of the costs of water services...'.
So we shall 'take account of' not 'incorporate'. And it does not require 'full cost recovery'.
Please stick a little bit closer to the text of the WFD here...
-
We have added revision to the text
'EU Member States are requested to incorporate principles such as full cost recovery and incentive water pricing into their pricing schemes for water services.'
This is not what the WFD asks from us: Art 9 says 'Member States shall take account of the principle of recovery of the costs of water services...'.
So we shall 'take account of' not 'incorporate'. And it does not require 'full cost recovery'.
Please stick a little bit closer to the text of the WFD here...
-
During 2005-2019, expenditure on water supply and sanitation services in European countries remained consistently the lowest among expenditure on other household needs. Nonetheless, middle income households in Lithuania, Latvia and Greece exhibit the lowest levels of residual income left after covering the household needs considered (4-10% in the worst years). This leaves little margin to absorb additional price hikes in the future. Alternatively, households in western European countries such as Ireland, the Netherlands and France often had 50% or more of their income still available after covering such expenses during the same period, while their expenditure on water supply services is comparatively low.
-
I am not sure whether this still holds for the Netherlands nowadays: More and more households in the Netherlands have more and more difficulties to find affordable homes. So, costs for housing is taking a large and increasing part of household income.
But maybe I misunderstand the text here. In which case, I would suggest to have a second look at the text to make more clear what is meant here. My problem is that I don't understand what is meant by 'such expenditures' in the last line? As stated before, the costs for housing is getting too much for more and more households; a serious problem in our larger cities.
-
This is what the statistical data has yielded. Perhaps we will see that remainder become smaller in the coming years (the latest datapoints are from 2019). We have added a couple of edits to try and clarify what the text is referring to.
I am not sure whether this still holds for the Netherlands nowadays: More and more households in the Netherlands have more and more difficulties to find affordable homes. So, costs for housing is taking a large and increasing part of household income.
But maybe I misunderstand the text here. In which case, I would suggest to have a second look at the text to make more clear what is meant here. My problem is that I don't understand what is meant by 'such expenditures' in the last line? As stated before, the costs for housing is getting too much for more and more households; a serious problem in our larger cities.
-
-
It would be interesting to combine the information on cost recovery and expenditure level for the mentioned services for each country as subsidies for renewing the infrastructure are widely used.
A remarkable increase in expenditure levels for water supply services is observed in Romania (5.1 %) for the period, followed by high and moderate ones for Croatia (3.3%), Poland (1.5 %) and Slovakia (1.5%), respectively. Acknowledging the challenges associated with defining an affordability threshold for water services and with using it across countries, applying a 5% indicative threshold suggests that affordability of water services may be a concern for Romania in 2012 (4,4%), 2017 (4,7%) and 2019 (5,4%), and to less extent for Croatia in 2013 (3,3%).
I think this is a little overdone. Instead of 'is essential for' I would prefer 'contributes to' or 'is important since it contributes to'